Infographic ‘Down Under’
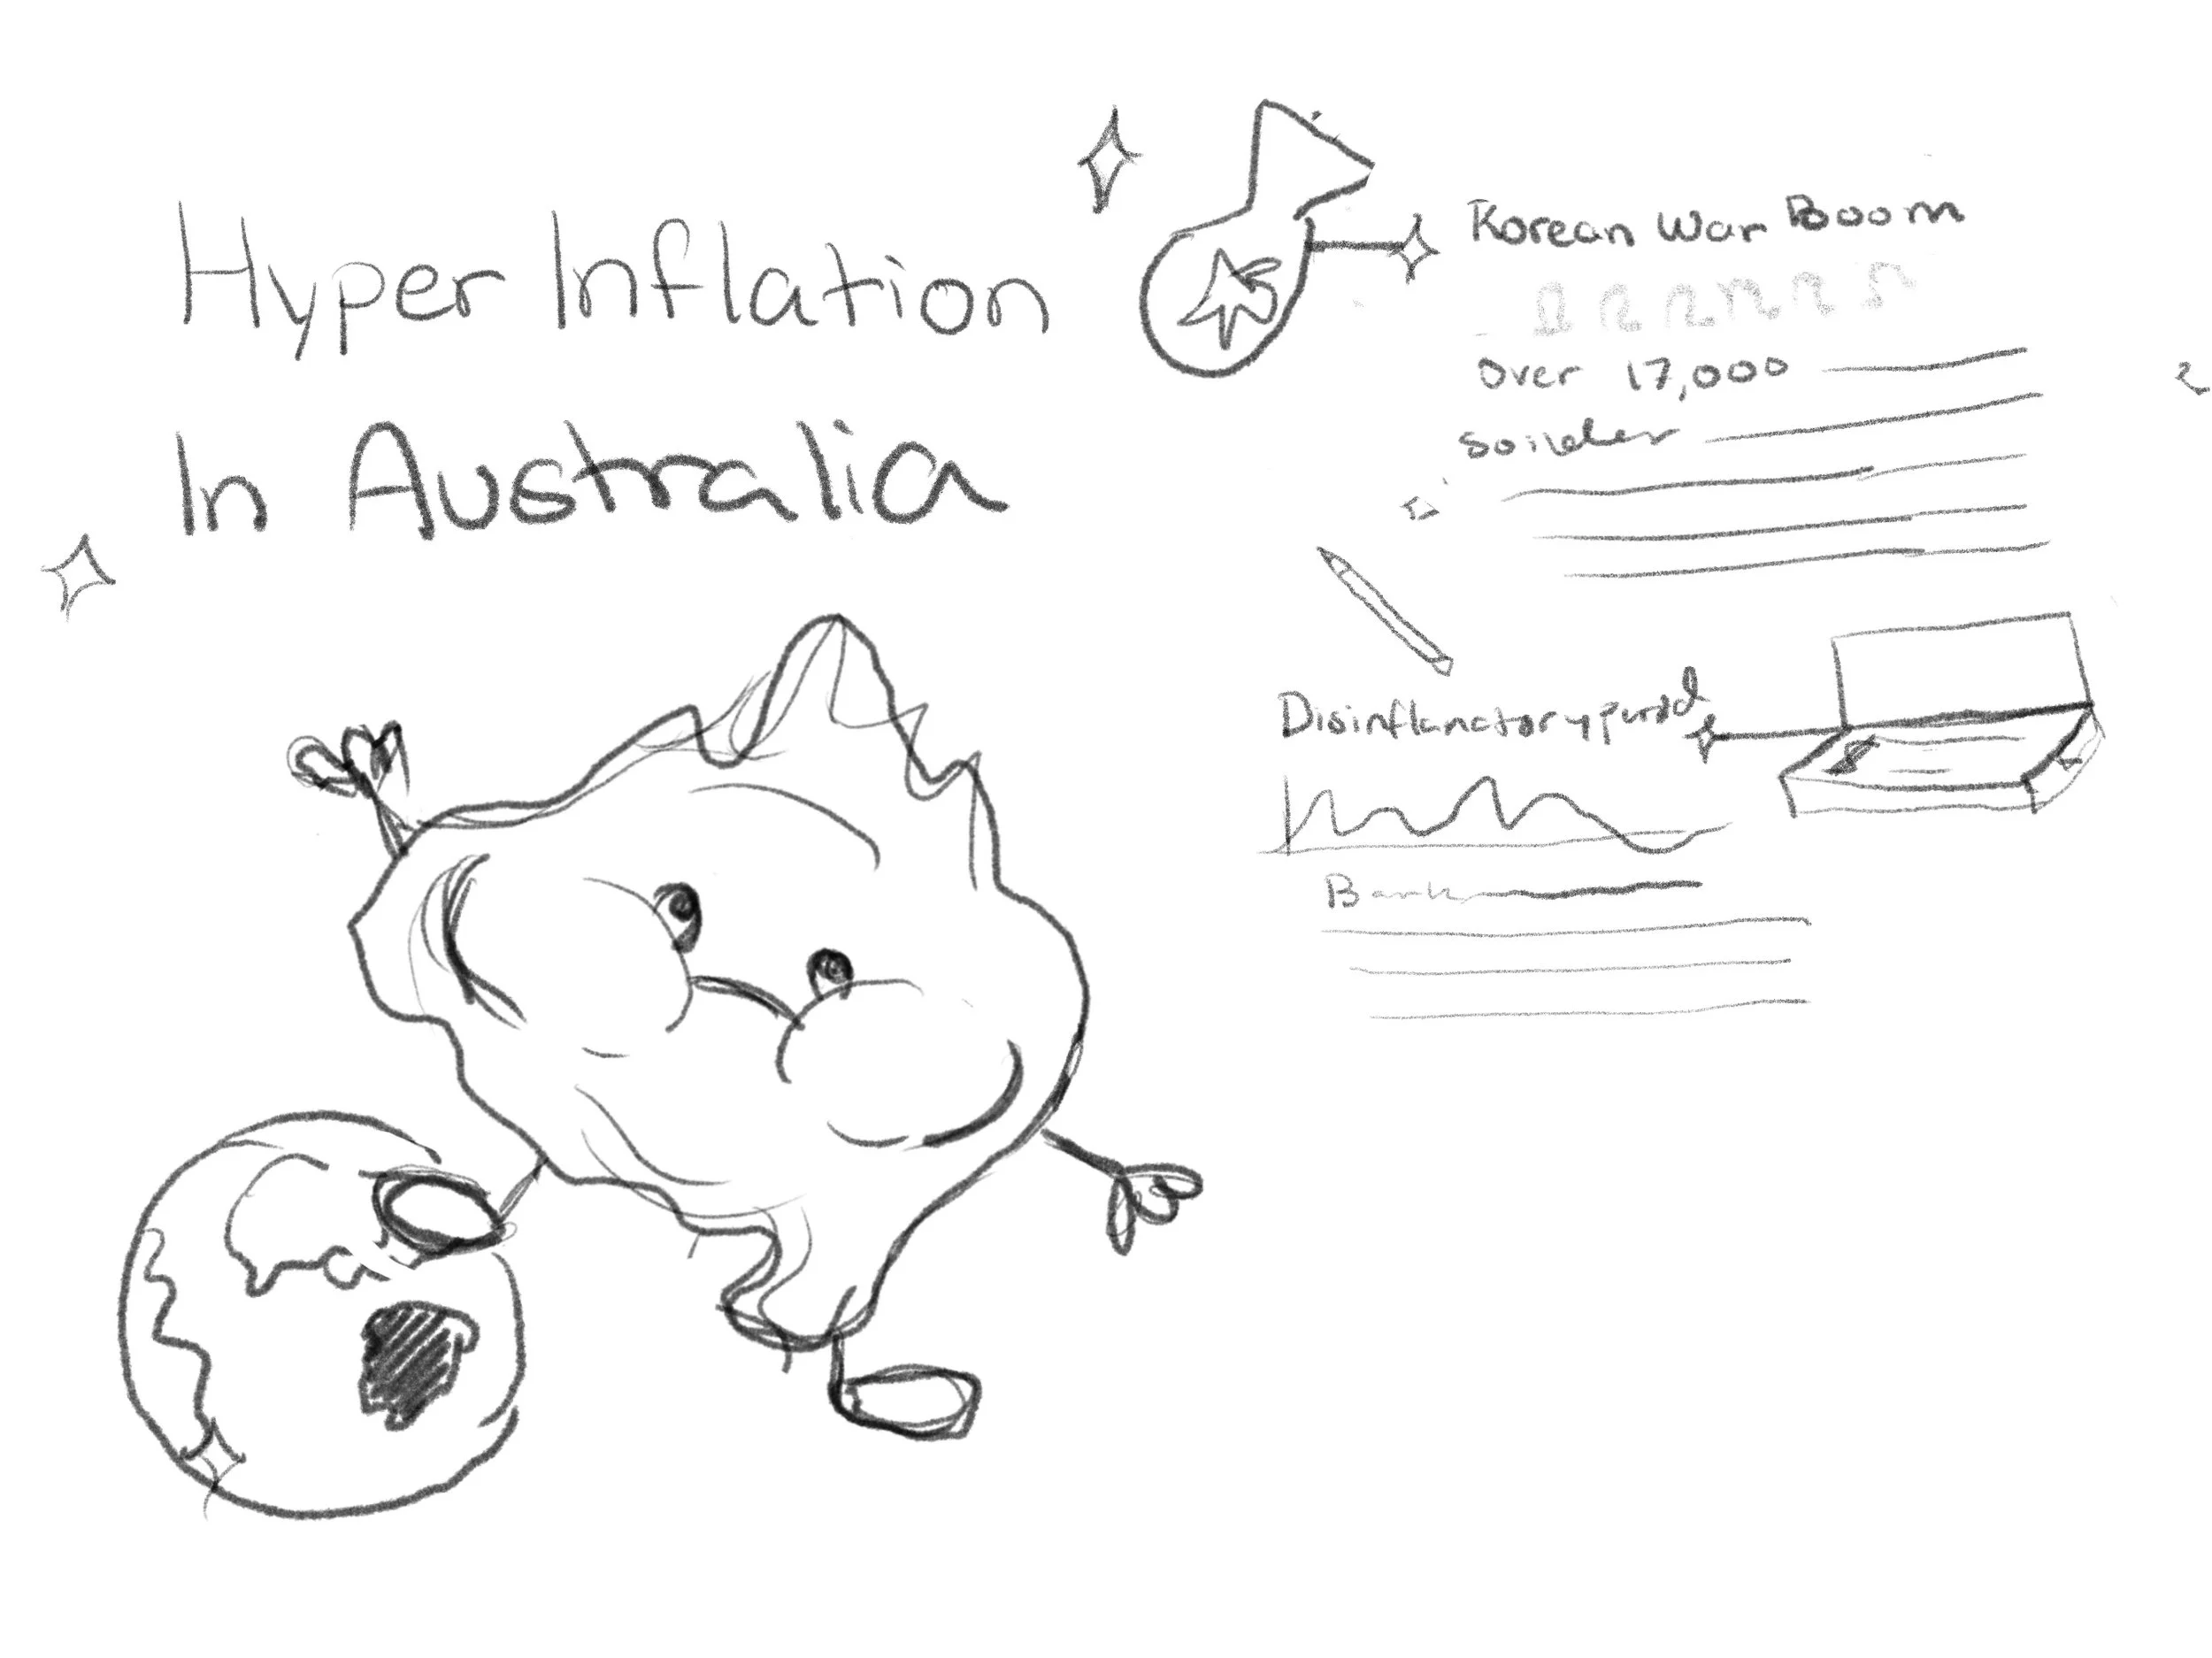
This is an Infographic poster that represents ‘The Effects of the Socio-Political Status in Australia and CPI% Fluctuations Throughout Time.’ This infographic looks the correlation between the minimum wage and the Consumer Price Index (CPI%) in Australia and its impact on the country's economic conditions. The analysis focuses on four significant events spanning from 1948 to 2018, each contributing to fluctuations in this relationship. These events include the Korean War Boom, the Early Disinflationary Period, Oil Price Shocks, and the Recession


